|
ProTISA is intended to collect confirmed translation initiation sites (TISs) for prokaryotic genomes. As of Oct 2008, it includes data for 728 genomes (676 Bacteria and 52 Archaea) with more than 700, 000 confirmed TISs. The confirmed data has supporting evidence from different sources, including experiments records in the public protein database Swiss-Prot, literature, conserved domain search and sequence alignment among orthologous genes. Combing with predictions from the-state-of-the-art TIS predictor MED-Start/MED-StartPlus (in release 1.0 & 1.2) and TriTISA (since release 1.4) and annotations on potential regulatory signals, the database can serve as a refined annotation resource for the public database RefSeq. |
Access The database can be retrieved via ��
Search search by region in the genome sequence, gene name and PID Browse refined TIS annotation for the whole genome Download download annotations in Flat Files (prepared for SQL) as well as source code
|
Related databases Alternative Translational Initiation Database http://bioinfo.au.tsinghua.edu.cn/atie/ Database of mRNA sequence with non-AUG start codon http://bioinfo.iitk.ac.in/bioinfo/ Translation Initiation Sites and Secretory Targets http://ipe.cbmeg.unicamp.br/pub/TISs-ST/ |
Citation Hu, G.-Q., Zheng, X., Yang, Y.-F., Ortet, P., She, Z.-S. and Zhu, H. (2008) ProTISA: a comprehensive resource for translation initiation site annotation in prokaryotic genomes. Nucleic Acids Research, 36:D114-D119 |
References
Bailey, T.L. and Elkan, C. (1994) Fitting a mixture model by expectation maximization to discover motifs in biopolymers, Proceedings / ... International Conference on Intelligent Systems for Molecular Biology ; ISMB, 2, 28-36. Frishman, D., Mironov, A., Mewes, H.W., and Gelfand, M. (1998) Combining diverse evidence for gene recognition in completely sequenced bacterial genomes. Nucleic Acids Research 26:2941-2947. Makita, Y. De Hoon MJL and Danchin, A. (2007) Hon-yaku: a biology-driven Bayesian methodology for identifying translation initiation sites in prokaryotes. MBC Bioinformatics 8:47. Torarinsson, E., Klenk, H.P., Garrett, R.A. (2005) Divergent transcriptional and translational signals in Archaea. Environmental microbiology 2005, 7:47-54. MED gene prediction series
Ouyang, Z., Zhu, H.Q., Wang, J. and She, Z.-S. (2004) Multivariate entropy distance method for prokaryotic gene identification. Journal of Bioinformatics and Computational Biology, 2: 353-373. (MED 1.0) Zhu, H.Q., Hu, G.-Q., Ouyang, Z., Wang, J. and She, Z.-S. (2004) Accuracy improvement for identifying translation initiation sites in microbial genomes. Bioinformatics 20:3308-3317. (MED-Start) Zhu, H.Q., Hu, G.-Q., Yang, Y.-F., Wang, J. and She, Z.-S. (2007) MED: a new non-supervised gene prediction algorithm for bacterial and archaeal genomes. BMC Bioinformatics, 8:97. (MED 2.0) Hu, G.Q., Liu, Y.C., Zheng, X.B., Yang, Y.F., She, Z.S., and Zhu, H.Q. (2008) New solutions of translation initiation site prediction for prokaryotic genomes. Progress in Biochemistry and Biophysics, 35(11): 1254-1262. (MED-StartPlus) TISA series on start finding for bacterial genomes
Hu, G.Q., Zheng, X.B., Yang, Y.F., Ortet, P., She, Z.S., and Zhu, H.Q. (2008) ProTISA: a comprehensive resource for translation initiation site annotation in prokaryotic genomes. Nucleic Acids Research, 36:D114-D119. (ProTISA) Hu, G.Q., Zheng, X.B., Ju, L.N., Zhu, H.Q., and She, Z.S. (2008) Computational evaluation of TIS annotation for prokaryotic genomes. BMC Bioinformatics, 9:160. (SupTISA) Hu, G.Q., Zheng, X.B., Zhu, H.Q., and She, Z.S. (2009) Prediction of translation initiation site for microbial genomes with TriTISA. Bioinformatics, 25(1): 123-125. (TriTISA) Hu, G.Q., Guo, J.T., Liu, Y.C., and Zhu, H.Q. (2009) MetaTISA: Metagenomic Translation Initiation Site Annotator for improving gene start prediction. Bioinformatics (in press). (MetaTISA) |
|
Last update on Dec. 2008, Copyright(C)2007, All Rights Reserved
|
FTP site 1 for download
Annotation files prepared for database management system such as MySQL and MS access.
Source codes (written in C++; under the GNU GPL license) for extracting CDC/HSC TIS and the new version of MED-Start.
ProTISA DOCUMENTATIONS
TIS and STP coordinates
PID and gene name
Signal visualization
Source codes
How confirmed TIS is collected?
Multiple TISs for one gene, which is the most likely one?
What evidence is shown for confirmed TIS?
Does ProTISA estimate the data's reliability?
How is the performance of TriTISA?
How the signals are recovered?
How signals are classified?
How to predict signal for each TIS?
TIS and STP coordinates
In ProTISA, TIS is recorded as the first position of the start codon, while STP is recorded as the third position of the STOP codon.
Return
PID and gene name
Almost all PIDs and gene names are collected from RefSeq. For genes not in RefSeq, no gene name is assigned and a temporary PID, beginning with "NC_", is used (randomly generated).
Return
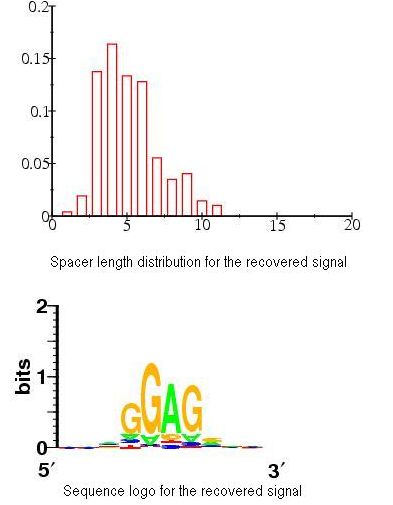
Signal visualization
We use the WebLogo to visualize the signal content and a histogram to visualize the signal preferred distance to TIS. The content of a signal is characterized by a positional weight matrix and the distance to TIS is measured by the number of nucleotide between the signal and TIS (spacer length):
Return
Source code
We welcome colleagues to apply the methods used in ProTISA to annotate TIS for any ongoing project. To facilitate this, we open our source code under the GNU GPL license. We haven't provided an on-the-fly tool to annotate TIS through analyzing the uploaded genome sequence and initial coordinate annotation. Searching in CDD and blasting against genes with CDC and IPT TIS are too time-consuming: for example, it would take about 4 hours for E. coli K12. This would become a heavy burden for our server. More importantly, many a genome sequencing groups are unwilling to upload the sequence before publication. Thus we believe opening the source code is the best way. All codes are written in C++ and can be run on any platform with a C++ complier. Check the FTP site for the source code.
Return
How confirmed TIS is collected?
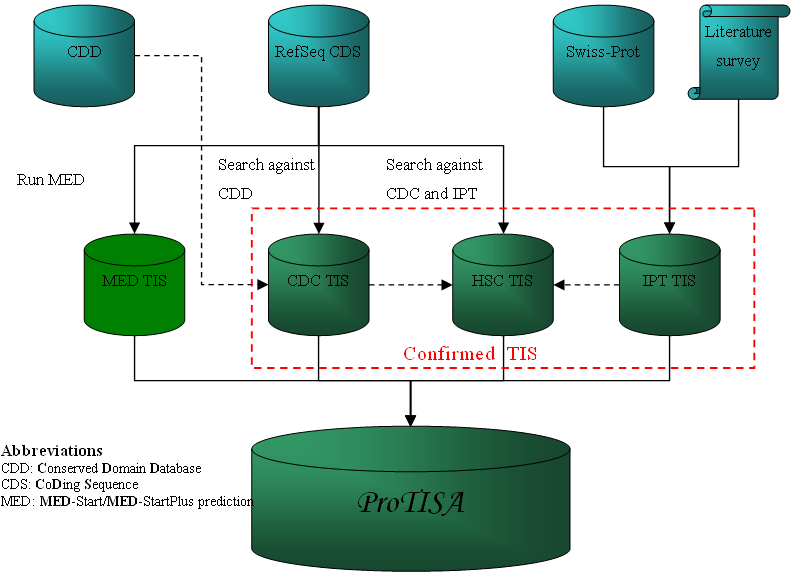
Confirmed TIS was collected from three sources, experimental data in Swiss-Prot or in literatures, conserved domain search and sequence alignment among orthologous genes. The TIS is classified into:
ImPorTed data: this is achieved by searching documented N term M cleavage with proteomics in the public database Swiss-Prot for all genomes and by reviewing literatures. To enrich the data set, we applied that, if the TIS of one gene is known, the TIS of its counterpart in another closely related species can possibly be determined through simple n-terminal sequence comparison. Data obtained in this section is labeled as IPT TIS.
Conserved Domain Confirmed: the method to identify reliable TIS through conserve domain search is essentially similar to that in Frishman et al (1998). We run for each gene against the Conserved Domain Database (% identity > 30, e-value < 0.00001). Then, TIS for the gene with only one possible start codon upstream to the 5'-most hit can be reliably identified; to compensate for random matches, we removed six amino acids from the most upstream match before processing (Larsen and Krogh, 2003). Data from this source is labeled as CDC TIS.
High Similarity Confirmed: the idea to identify TIS through sequence similarity search is described in Makita et al (2007). Briefly, it determines the TIS of a gene by referring to its orthologous genes from other genera (% identity > 40, % length difference < 20). It requires that they are aligned in the n-terminal region and the TISs of the referred genes should be known. In ProTISA, genes with IPT and CDC TIS constitute the references. Data from this source is labeled as HSC TIS.
MED-Start/MED-StartPlus prediction is replaced by the TriTISA prediction since release 1.4. But the TIS is still retained with the MED tag.
Return
Multiple TISs for one gene, which is the most likely one?
In some cases more than one TIS might be annotated in ProTISA for one gene. We include four classes of TIS: IPT, CDC, HSC and MED. Intuitively, the first three classes are more reliable than the last one, because they are confirmed by evidences from external database, literature or external genomes. However, there are few cases, about 1-2% of all genes, several confirmed TISs might be found for one gene. In this case, we proposed that the IPT TIS is the most reliable, because it stems from experiments, while CDC is more reliable than HSC because the former is used as reference for the later. In the case where more than one HSC TIS is annotated, we more prefer the most upstream one as true than others, because it is not likely that genes from different genera are conserved in the non-coding regions. Briefly, the proposed rule for selection among multiple TISs is: IPT > CDC > most upstream HSC (if exist) > HSC > MED.
However, behind the rule is a hypothesis that only one TIS exists for one gene. This might be not true, since there are hundreds of cases with multiple functional TISs reported in a recently published database http://bioinfo.au.tsinghua.edu.cn/atie/. Further, other factors such as the mRNA secondary structure and regulatory signal might co-select the TIS. Thus, the proposed rule is indicative for the user.
Return
What evidence is shown for confirmed TIS?
The "TIS Types" column in the TIS annotation interface provides links to the evidences that support us to label a TIS as IPT, CDC or HSC.
This is a screenshot from E. coli K12 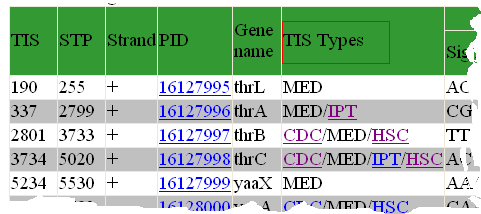
|
For IPT TIS, If the TIS is extracted from an outside database, its ID in that database is shown, and if the TIS is supported by literature, then the PMID is shown:
This is shown for DnaK in E. coli K12. In this case, the TIS is supported both by Swiss-Prot and by EcoGene. 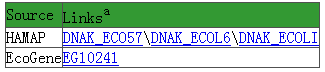
|
For CDC TIS, information about the most upstream conserved domain hit is shown:
This is shown for DnaJ in E. coli K12. The website summarizes the evidence in a table 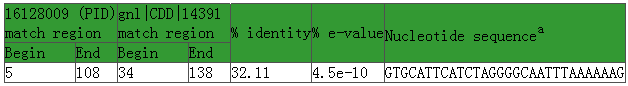
We interpret the results in a figure as below 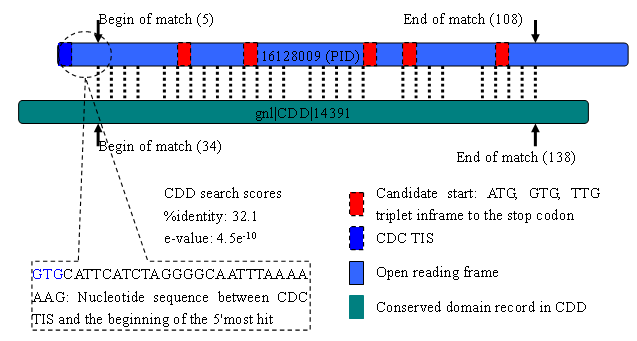
|
In the process of identify HSC TIS, BlastP is run between the target gene and its orthologous gene with known TIS (% identity > 30, % length difference < 20). If the match region begins from the first amino acid in the orthologous gene, then the TIS of the target gene can be inferred. To eliminate ambiguity, it further requires only one candidate TIS located in the 5AA vicinity of the proposed TIS (see Makita et al, (2007) for details).
Let's take carA in E. coli K12 as an example. 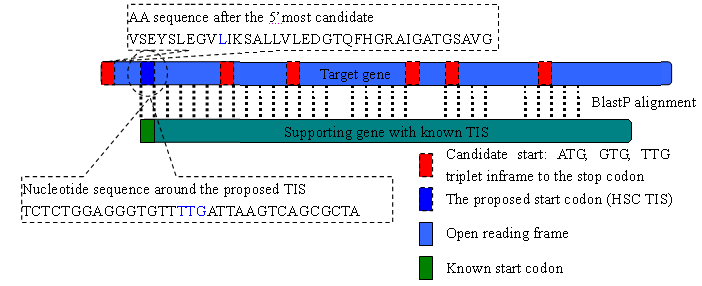
The n-terminal sequence beginning from the 5'most candidate TIS is "VSEYSLEGVLIKSALLVLEDGTQFHGRAIGATGSAVG". However, the alignment to orthologous genes suggest the that the protein begins from "LIKSALLVLEDGTQFHGRAIGATGSAVG", of which the first AA L corresponds to TTG, on of the candidate stat codons. Further, no alternative TIS represents in the vicinity of the proposed TIS. According to Makita et al, (2007), the TTG is muck likely to be the true TIS. Orthologous genes are listed as below 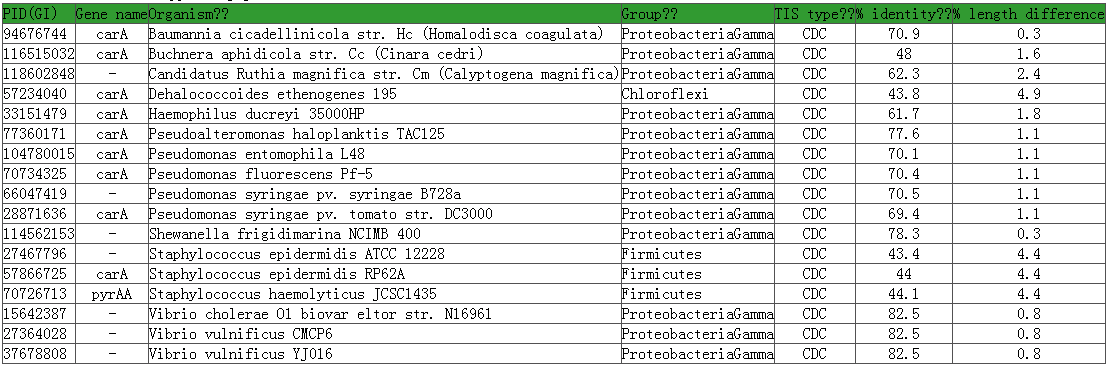
A total of 17 genes support the selection of the HSC TIS; they distributes in ten different genera and three groups. In fact, a HSC TIS is annotated only if it has supporting orthologous genes distributed in more than two other genera (see more in the next section). |
Multiple n-terminal sequence alignments among the orthologous genes provide further support for the choice of the HSC TIS.
Let's take carA in E. coli K12 as an example. The alignment is conducted on n-terminal sequences. For supporting orthologous genes from the same genus, one is randomly selected in the alignment. 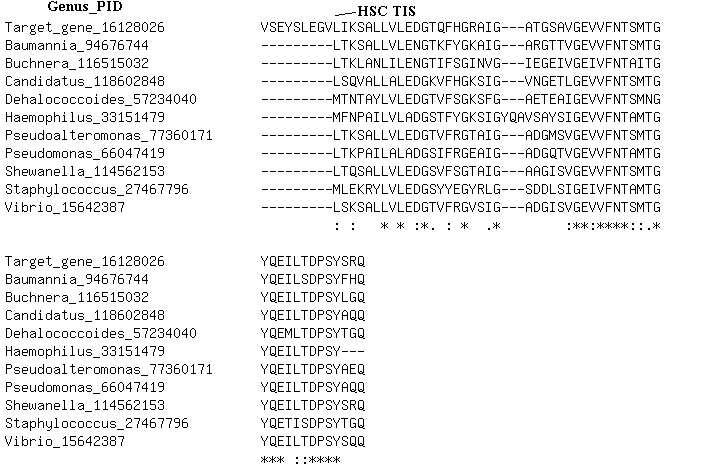
|
Return
Does ProTISA estimate the data's reliability?
The IPT TISs constitute the most reliable resource in ProTISA and they are firstly used to estimate the reliability of CDC TIS and HSC TIS. After removing redundant data, we have 3413 genes labeled with IPT TIS. A total of1568 TISs are also labeled with CDC, of which 1558 (99.4%) TISs are consistent with IPT, and 1894 TISs are labeled with HSC, of which 1875 (99.0%) are consistent with IPT.
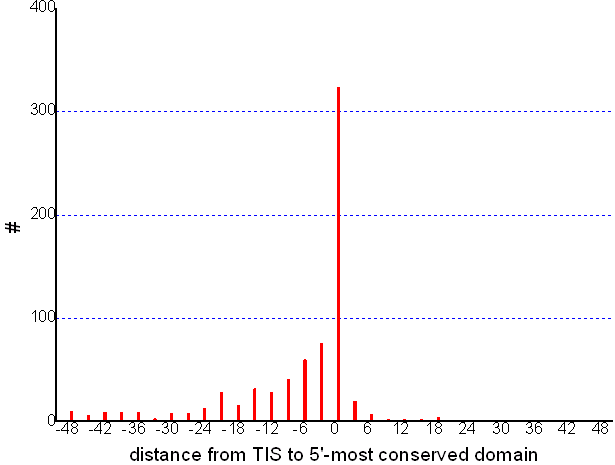
In our scheme, a CDC TIS can be wrong if the most upstream conserved domain hit overlaps a non-coding region by more than six amino acids. With experimentally determined TISs from EcoGene, we show below the distribution of the distance (BP) from TIS to the 5'-most predicted conserved domain. It demonstrates that such cases rarely happens (about 0.1%). Let the percentage of gene with conserved domain overlapping the non-coding region, the number of genes having conserved domain hits and the number of found CDC TIS be p, N and n, respectively. Then low bound of the accuracy of CDC TIS can simply be pN/n. To estimate the reliability of the CDC TIS, we let p = 0.1%, which is calculated from IPT TIS, and N and n be calculated from the database construction procedure, then the accuracy is over 99.0%.
The HSC TIS is biologically sound: protein translated from a HSC TIS is likely to maintain the function inferred from its orthologous genes with known TISs. Further, HSC TIS can serve as interesting materials to study translation initiation signal evolution among orthologous genes and to imply potential re-initiation events; actually, about 1% of genes were found with more than one HSC TIS. Nevertheless, we are aware that errors in IPT and CDC TIS would propagate to HSC TIS, especially among closely related genomes. To minimize such errors, HSC TIS is generated under that it has the supporting orthologous genes distributed in at least two different other genera.
Return
How is the performance of TriTISA?
See Hu, G.Q., Zheng, X.B., Zhu, H.Q., She, Z.S. (2008) Prediction of translation initiation site for microbial genomes with TriTISA. Bioinformatics, 25(1): 123-125.
Return
How the signals are recovered?
Based on current knowledge, two kinds of regulatory signals are reported upstream of TIS. One is the Shine-Dalgarno signal which functions to recruit the small ribosome subunit by reversely complementing to the 3'end of 16S rRNA (Shine & Dalgarno, 1974). The signal typically locates in the 20 bps upstream region of TIS. Another signal is the Pribnow Box (TATA-Box) in Bacteria (Archaea). In Bacteria, it locates about 10 bps upstream of the transcription initiation site and is recognized by the Sigma70 factor (Shultzaberger, et al 2007 and references therein), while in Archaea, it locates about 30 bps upstream and is recognized by the transcript factor TFB (Torarinsson, et al 2005 and references therein). This prior knowledge helps us to set the region where to find potential signals: 20 bps upstream of TIS for bacteria, while 50 bps for Archaeal. We implemented a MEME-like algorithm to recover potential regulatory signals (Bailey and Elkan, 1994). It combines the contribution of the signal content, the signal position relative to TIS and the background nucleotide frequencies into a likelihood function.
We extract sequences L-bp (L=20 for bacteria and 50 for archaea) upstream of TIS and denote them as set S with a size of N. We assume M types of signals to be recovered. The statistic properties of each signal is characterized by a W*4 positional weight matrix {wmis} and a position distribution {pmj}, where W denotes the length of the signal (W is set to be long enough to include the signals. In our practices, W = 10 for bacteria and W = 15 for archaea work well), wmiv denotes the probability that a base v appear at the i-th nucleotide of signal m and pmj denotes the probability that signal m starts from the j-th nucleotide of a sequence. The background base composition is denoted by {bs}. Let Omega denote the whole parameter set, then the likelihood function can be expressed as (for two kind of signals: A, B, M =2)
An EM algorithm and a simulative annealing strategy are employed to maximize this function.
In practice, based on current knowledge, we first let M = 2 to recover signals for each genome. These signals can be easily classified into three categories: SD-like, TA-like and Atypical. In the case where the two signals fall in the same category, we re-cover the signal by letting M=1 to decrease redundancy.
Return
How signals are classified?
To classify the signals, we include two kinds of signals as references, Shine-Dalgarno signals and the Pribnow (TATA) box. For Shine-Dalgarno signal, the widely accepted consensus "AAGGAGGTGA" is used (Ma, et al 2002). For the Pribnow box in bacteria, we cite the weight matrix of the -10 promoter in Escherichia coli (Hershberg, et al 2001). For the TATA-box in Archaea, we use the AT-rich motif found in A. fulgidus (a median-GC Archaea).
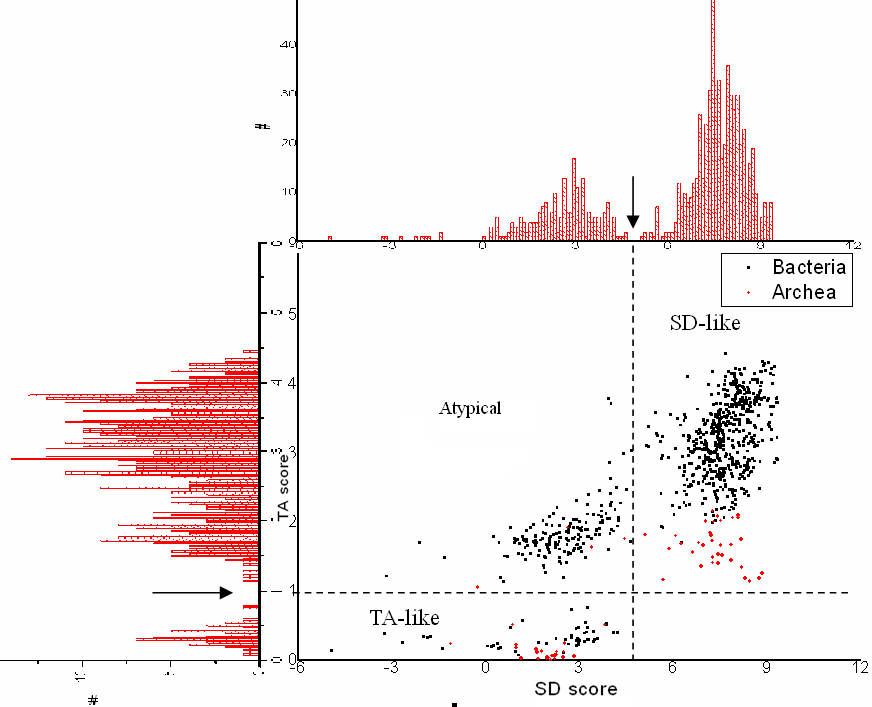
We calculate two scores for each signal, i.e., the SD score and the TA score. Before that, the effect of the background composition noise was compensated (Hasan and Schreiber, 2006). The known consensus "AAGGAGGTGA" is scored (negative logarithm of the probability) against the positional weight matrix of the signal to obtain the SD score, while the Euclidean distance between the signal weight matrix and the referenced weight matrix is calculated for the TA score.
It is attractive that each kind of score follows a bimodal distribution, which allows us to readily classify the signals into three categories: 1) TA-like, those resemble the Pribnow (TATA) Box; 2) SD-like, those resemble the Shine-Dalgarno signal; and 3) others (Atypical).
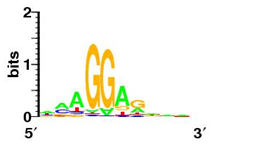
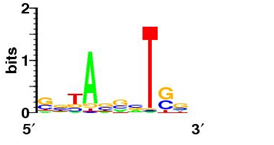
Bellow shows some sequence logos for representative signals from each class
 |
 |
| SD-like signal (E. coli K12) |
TA-like signal (Pribnow box, S. coelicolor) |
 |
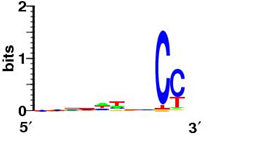 |
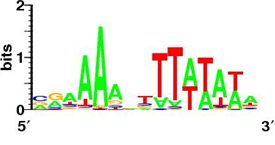
| TA-like (TATA box, A. fulgidus) |
Atypical (Synechocystis sp. PCC 6803) |
Return
How to predict signal for each TIS?
A Bayseian methodology is employed to predict the potential signal upstream of a TIS. Since release 1.4, we calculate the Bayesian post-probability, instead of the R-score, that a sequence is from signal A, or B, or background (BKG):
P(A) = L(A)/(L(A)+L(B)+L(BKG))
P(B) = L(B)/(L(A)+L(B)+L(BKG))
P(BKG) = L(BKG)/(L(A)+L(B)+L(BKG))
, where L(A), L(B), and L(BKG) are shown previously.
A signal is regarded from A, if P(A) = max{P(A), P(B), P(BKG)}, and this rule applies for B and BKG. For genomes with only one signal, say A, a sequence is regarded to have such signal, if the signal score P(A) is over the score from background; namely if P(A) > 0.5.
Return
References
Bailey, T.L. and Elkan, C. (1994) Fitting a mixture model by expectation maximization to discover motifs in biopolymers, Proceedings / ... International Conference on Intelligent Systems for Molecular Biology ; ISMB, 2, 28-36.
Crooks, G.E., Hon, G., Chandonia, J.M., Brenner, S.E. WebLogo: A sequence logo generator, Genome Research, 14:1188-1190, (2004)
Frishman, D. et al. (1998) Combining diverse evidence for gene recognition in completely sequenced bacterial genomes. Nucleic Acids Research 26:2941-2947
Hansan, S. and Schreiber, M. Recovering motifs from biased genomes: application of signal correction. Nucleic Acids Research 34:5124-5132.
Hershberg, et al. (2001) PromEC: An updated database of Escherichia coli mRNA promoters with experimentally identified transcriptional start sites. Nucleic Acids Research 29:277
Hu, G.-Q.et al. (2007) Improved prediction of prokaryotic TIS for genomes with a wide variety of GC content. (submitted)
Larsen, T.S. and Krogh, A. (2003) EasyGene �C a prokaryotic gene finder that ranks ORFs by statistical significance. BMC Bioinformatics 4:21
Ma, J. et al. (2002) Correlations between Shine-Dalgarno Sequences and Gene Features Such as Predicted Expression Levels and Operon Structures. Journal of Bacteriology 184:5733-5745.
Makita, Y. et al. (2007) Hon-yaku: a biology-driven Bayesian methodology for identifying translation initiation sites in prokaryotes. MBC Bioinformatics 8:47
Poole II, F.L. et al. (2006) Defining genes in the genome of the Hyperthermophilic Archaeon Pyrococcus furiosus: Implications for all microbial genomes. Journal of Bacteriology 187:7325-7332
Shine, J. and Dalgarno, L. (1974) The 30-terminal sequence of E. coli 16S RNA: complementarity to nonsense triplets and ribosome binding sites. Proceedings of the National Academy of Sciences of the United States of America 71:1342-1346.
Shultzaberger, R.K. et al. (2007) Anatomy of Escherichia coli Sigma70 promoters. Nucleic Acids Research 35:771-788
Torarinsson, E. et al. (2005) Divergent transcriptional and translational signals in Archaea. Environmental microbiology 2005, 7:47-54.
Zhu, H.Q. et al. (2004) Accuracy improvement for identifying translation initiation sites in microbial genomes. Bioinformatics 20:3308-3317
Return
Number of genomes (as of Oct, 2008)
| Kingdom |
Group |
#genome |
#gene |
| Archaea |
Crenarchaeota |
16 |
33,214 |
| Euryarchaeota |
34 |
75,227 |
| Nanoarchaeota |
1 |
539 |
| Other Archaea |
1 |
1,605 |
| Bacteria |
Acidobacteria |
2 |
12,609 |
| Actinobacteria |
54 |
221,947 |
| Aquificae |
3 |
4,888 |
| Bacteroidetes/Chlorobi |
24 |
67,567 |
| Chlamydiae/Verrucomicrobia |
13 |
13,809 |
| Chloroflexi |
7 |
22,106 |
| Cyanobacteria |
33 |
102,071 |
| Deinococcus-Thermus |
4 |
8,931 |
| Firmicutes |
148 |
377,383 |
| Fusobacteria |
1 |
2,070 |
| Planctomycetes |
1 |
7,328 |
| Proteobacteria(Alpha) |
88 |
257,907 |
| Proteobacteria(Beta) |
58 |
185,022 |
| Proteobacteria(Delta) |
19 |
75,915 |
| Proteobacteria(Epsilon) |
20 |
36,136 |
| Proteobacteria(Gamma) |
173 |
605,293 |
| Spirochaetes |
13 |
18,427 |
| Thermotogae |
7 |
13,050 |
| Other Bacteria |
8 |
20,153 |
| Sum |
�� |
728 |
2163,197 |
Number of IPT, CDC and HSC TIS (as of Oct, 2008)
| Kingdom |
Group |
IPT |
CDC |
HSC |
Multi_TISb |
Multi_HSCc |
Gened |
| Archaea |
Crenarchaeota |
207 |
7,068 |
3,930 |
92 |
43 |
8,256 |
| Euryarchaeota |
512 |
18,997 |
13,241 |
271 |
133 |
23,274 |
| Nanoarchaeota |
0 |
152 |
68 |
2 |
1 |
168 |
| Other Archaea |
0 |
326 |
213 |
8 |
4 |
394 |
| Bacteria |
Acidobacteria |
0 |
1,836 |
1,645 |
37 |
18 |
2,538 |
| Actinobacteria |
731 |
31,670 |
28,670 |
688 |
314 |
46,708 |
| Aquificae |
3 |
1,869 |
1,245 |
19 |
7 |
2,075 |
| Bacteroidetes/Chlorobi |
11 |
14,105 |
14,982 |
289 |
209 |
18,953 |
| Chlamydiae/Verrucomicrobia |
68 |
3,937 |
2,653 |
46 |
26 |
4,533 |
| Chloroflexi |
0 |
3,881 |
3,982 |
92 |
42 |
5,558 |
| Cyanobacteria |
320 |
21,646 |
19,615 |
372 |
203 |
28,435 |
| Deinococcus-Thermus |
102 |
2,015 |
1,393 |
40 |
11 |
2,672 |
| Firmicutes |
1,453 |
103,150 |
93,060 |
1,337 |
828 |
129,894 |
| Fusobacteria |
2 |
773 |
474 |
5 |
2 |
852 |
| Planctomycetes |
0 |
439 |
466 |
13 |
9 |
680 |
| Proteobacteria(Alpha) |
298 |
52,181 |
58,812 |
1,338 |
729 |
79,126 |
| Proteobacteria(Beta) |
95 |
36,868 |
46,694 |
922 |
535 |
59,580 |
| Proteobacteria(Delta) |
20 |
13,711 |
13,299 |
299 |
157 |
19,246 |
| Proteobacteria(Epsilon) |
65 |
11,240 |
9,239 |
144 |
96 |
13,218 |
| Proteobacteria(Gamma) |
26,667 |
163,609 |
190,594 |
3,399 |
2,144 |
239,305 |
| Spirochaetes |
24 |
3,869 |
2,846 |
43 |
25 |
4,735 |
| Thermotogae |
21 |
3,474 |
2,617 |
48 |
30 |
4,230 |
| Other Bacteria |
1 |
3,859 |
3,689 |
68 |
45 |
5,315 |
| Sum |
�� |
30,600 |
500,675 |
513,427 |
9,572 |
5,611 |
699,745 |
a Number of gene with more than one TIS labeled as IPT, CDC or HSC. b Number of gene having more than one TIS labeled as HSC. c Number of genes with TIS labeled as IPT, CDC or HSC.
A detailed list complied for each species is available here (XLS Excel file).
Signal type distribution among taxonomic group (as of Oct, 2008)
| Kingdom |
Group |
SD_like only |
SD_like & TA_like |
SD_like & Atypical |
TA_like & Atypical |
Atypical only |
| Archaea |
Crenarchaeota |
1 |
14 |
1 |
0 |
0 |
| Euryarchaeota |
11 |
20 |
0 |
3 |
0 |
| Nanoarchaeota |
0 |
1 |
0 |
0 |
0 |
| Other Archaea |
0 |
1 |
0 |
0 |
0 |
| Bacteria |
Acidobacteria |
0 |
2 |
0 |
0 |
0 |
| Actinobacteria |
0 |
52 |
0 |
2 |
0 |
| Aquificae |
1 |
2 |
0 |
0 |
0 |
| Bacteroidetes/Chlorobi |
0 |
0 |
11 |
0 |
13 |
| Chlamydiae/Verrucomicrobia |
1 |
0 |
12 |
0 |
0 |
| Chloroflexi |
1 |
3 |
3 |
0 |
0 |
| Cyanobacteria |
0 |
0 |
17 |
0 |
16 |
| Deinococcus-Thermus |
0 |
4 |
0 |
0 |
0 |
| Firmicutes |
126 |
14 |
6 |
0 |
2 |
| Fusobacteria |
1 |
0 |
0 |
0 |
0 |
| Planctomycetes |
0 |
0 |
1 |
0 |
0 |
| Proteobacteria(Alpha) |
23 |
0 |
64 |
0 |
1 |
| Proteobacteria(Beta) |
3 |
2 |
53 |
0 |
0 |
| Proteobacteria(Delta) |
10 |
4 |
5 |
0 |
0 |
| Proteobacteria(Epsilon) |
20 |
0 |
0 |
0 |
0 |
| Proteobacteria(Gamma) |
144 |
4 |
24 |
0 |
1 |
| Spirochaetes |
5 |
1 |
7 |
0 |
0 |
| Thermotogae |
7 |
0 |
0 |
0 |
0 |
| Other Bacteria |
3 |
1 |
2 |
0 |
2 |
| Sum |
�� |
357 |
125 |
206 |
5 |
35 |
Statistics on the number of genes with different signals is available here (XLS Excel file) for each genome.
Or contact the authors via emails
Thanks Zhou Chang-Ling and Yu Da-Qi for technique supports